STAM 102 :: Lecture 11 :: t-test for two samples and ANOVA with One-way classification
![]()
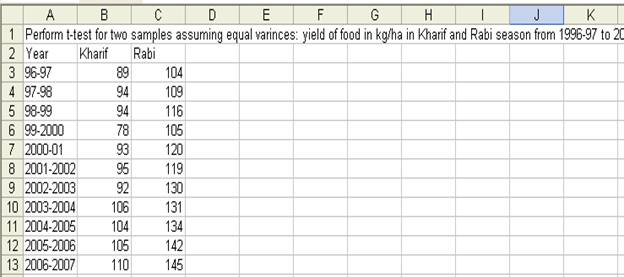
t-test for two samples assuming equal variances:
- Example: Perform t-test for two samples assuming equal variances for yield of food in kg/ha in Kharif and Rabi season from 1996-97 to 2006-07.
- The data is entered in Excel sheet as shown below:
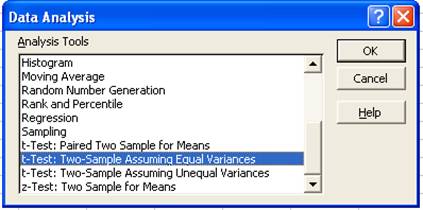
- Choose t-Test: Two-Samples assuming Equal Variances in the Data Analysis window:
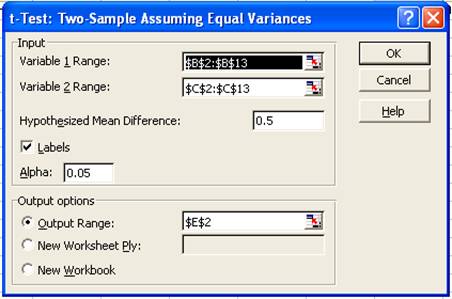
- In the t-Test: Two-Samples assuming Equal Variances window enter the Variable 1 Range and Variable 2 Range.
- Check the Labels option
- Hypothesized mean difference be 0.5
- Let Alpha value be 0.05
- Set output range as E2.
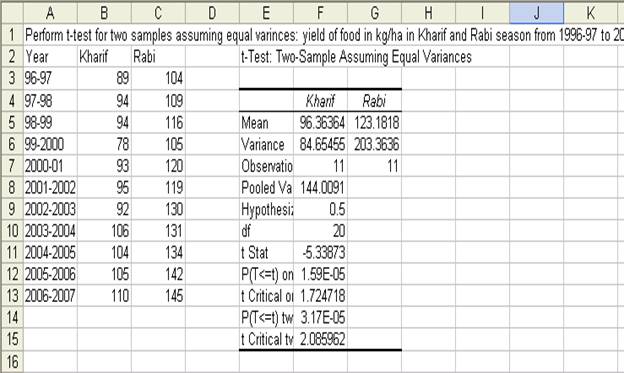
- The result will be displayed from E2 as shown below:
ANOVA(Analysis od Variances) with One-way Classification
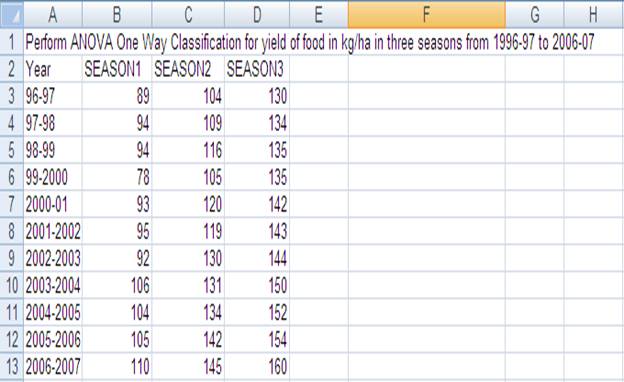
- Example: Perform ANOVA One Way Classification for yield of food in kg/ha in three seasons from 1996-97 to 2006-07
- The data is entered in Excel sheet as follows:
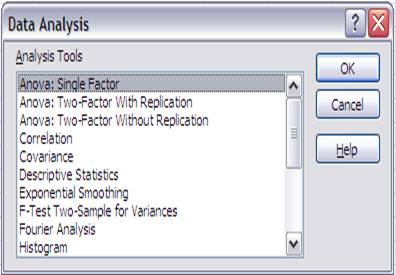
- Choose ANOVA: Single Factor from Data Analysis window.
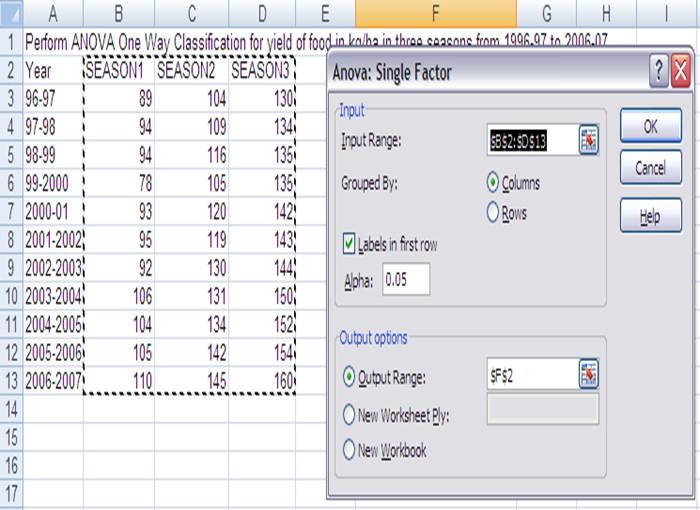
- In the ANOVA: Single Factor window enter the input range. The input range in the example is B2:D13
- Choose Group by Columns
- Check Labels in the first row
- Output range is set to F2 as follows:
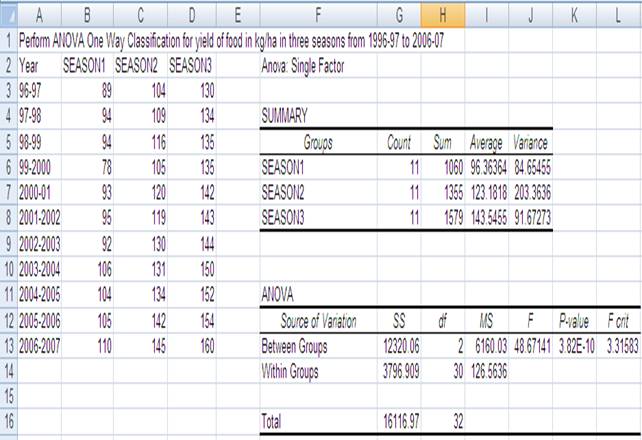
- The result of the ANOVA with One-way classification is displayed from F2 as shown below:
| Download this lecture as PDF here |
![]()