AECO 242 :: Lecture 07 :: WAREHOUSING AND FOOD CORPORATION OF INDIA
![]()
Warehousing
Meaning and Functions
Warehouses are scientific storage structures especially constructed for the protection of the quantity and quality of stored products. Warehousing may be defined as the assumption of responsibility for the storage of goods. It may be called the protector of national wealth, for the produce stored in warehouses is preserved and protected against rodents, insects and pests, and against the ill-effect of moisture and dampness.
The warehousing scheme in India is an integrated scheme of scientific storage, rural credit, price stabilization and market intelligence and is intended to supplement the efforts of co-operative institutions. The important functions of warehouses are:
1. Scientific Storage: Here, a large bulk of agricultural commodities may be stored. The product is protected against quantitative and qualitative losses by the use of such methods of preservation as are necessary.
2. Financing: Warehouses meet the financial needs of the person who stores the product. Nationalized banks advance credit on the security of the warehouse receipt issued for the stored products to the extent of 75 to 80 per cent of their value.
3. Price Stabilization: Warehouses help in price stabilization of agricultural commodities by checking the tendency to making post-harvest sales among the farmers. Farmers or traders can store their products during the post-harvest season, when prices are low because of the glut in the market. Warehouse helps in staggering the supplies throughout the year. They thus help in the stabilization of agricultural prices.
4. Market Intelligence: Warehouses also offer the facility of market information to persons who hold their produce in them. They inform them about the prices prevailing in the period, and advise them on when to market their products.
This facility helps in preventing distress sales for immediate money needs or because of lack of proper storage facilities. It gives the producer holding power; he can wait for the emergence of favourable market conditions and get the best value for his product.
Types of Warehouses
Warehouses may be classified on two bases:
1. On the Basis of Ownership
(a) Private Warehouses: These are the warehouses which are owned by the government and are meant for the storage of goods of any member of the public against a prescribed storage charge. The method of operation and the charges for storage are regulated by the government.
(b) Bonded Warehouses: These warehouses are specially constructed at a seaport or an airport and accept imported goods for storage till the payment of customs by the importer of goods. These warehouses are licensed by the government for this purpose. The owner of the warehouse gives an undertaking to the government that customs duty will be collected from the person before he is allowed to remove the goods from the warehouse. In other words, the goods stored in this warehouse are bonded goods. They may be owned by the dock authorities or privately-owned; but they have to work under the close supervision and control of the customs authorities. The following services are rendered by bonded warehouses:
(i) The importer of goods is saved from the botheration of paying customs duty all at one time because he can take delivery of the goods in parts.
(ii) The operation necessary for the maintenance of the quality of goods – spraying and dusting, are done regularly.
(iii) Entrepot trade (re-export of imported goods) becomes possible. The importer may take delivery of the goods without paying the customs duty if they are to be re-exported. He is thus saved from the botheration of first making the payment of customs duties on imported goods and then getting a refund on re-exported goods.
2. On the Basis of Type of Commodities Stored
(a) General Warehouses: These are ordinary warehouses used for storage of most of foodgrains, fertilizers etc. In constructing such warehouses no commodity-specific requirement is kept in view.
(b) Special Commodity Warehouses: These are warehouses which are specially constructed for the storage of specific commodities like cotton, tobacco, wool and petroleum products. They are constructed on the basis of the specific requirements of the commodity.
(c) Refrigerated Warehouses: These are warehouses in which temperature is maintained as per requirements and are meant for such perishable commodities as vegetables, fruits, fish, eggs and meat. The temperature in these warehouses is maintained below 30o to 50oF or even less, so that the product may not get spoiled by high atmospheric temperature.
Warehousing in India
In 1928, the Royal Commission on Agriculture underscored the need for a warehousing system in India. The Central Banking Enquiry Committee, 1931, too, drew attention to this need. The Reserve Bank of India emphasized the need for warehouses as early as in 1944, and proposed that every State Government should enact legislation to regulate the functioning of warehouses. The All-India Rural Credit Survey Committee of the Reserve Bank of India (set up in 1951 and submitted its report in 1954) also made comprehensive recommendations for the development of warehousing as an integrated scheme of rural credit and marketing. As a result of the recommendations of the Committee, the Government of India enacted the Agricultural Produce (Development and Warehousing) Corporations Act, 1956. The Act provided for:
(a) The establishment of a National Co-operative Development and Warehousing Board (which was set up on 1st September, 1956);
(b) The establishment of the Central Warehousing Corporation (which was established at Delhi on 2nd March, 1957); and
(c) The establishment of State Warehousing Corporations in all the States in the country (which were established in various states between July 1957 and August 1958).
In 1962, the Government of India decided to break up the Act of 1956 into two separate Acts – the National Co-operative Development Corporation Act, 1962, and the Warehousing Corporations Act, 1962. The Warehousing Corporations Act came into operation on 18th March, 1962. The Act defines the specific functions and the area of operations of Central and State Warehousing Corporations. It enlarged the list of the number of commodities meant for storage.
(a) National Co-operative Development and Warehousing Board
This board was set up on 1st September 1956 to perform the following functions:
(i) To advance loans and grants to State Governments for financing co-operative societies engaged in the marketing, processing or storage of agricultural produce, including contributions to the share capital of these institutions;
(ii) To provide funds to warehousing corporations and the State Governments for financing co-operative societies for the purchase of agricultural produce on behalf of the Central Government.
(iii) To subscribe to the share capital of the Central Warehousing Corporation and advance loans to State Warehousing Corporations and the Central Warehousing Corporation;
(iv) To plan and promote programmes through co-operative societies for the supply of inputs for the development of agriculture; and
(v) To administer the National Warehousing Development Fund.
In March 1963, the Board was converted into the National Co-operative Development Corporation (NCDC), and its functions were limited to co-operative development.
(b) Central Warehousing Corporation (CWC)
This Corporation was established as a statutory body in New Delhi on 2nd March, 1957. Under the new Act, the Central Warehousing Corporation was formally re-established on March 18, 1963. This Corporation which made a modest start with seven warehouses, with 7,000 tonnes capacity, in December 1957, had set up 458 warehouses in different places in the country, with a total storage capacity of 78.87 lakh tones at the end of March 2001. Of this, the present utilization is nearly 85 per cent of the total available capacity. CWC is operating 487 Warehouses across the country with a storage capacity of 10.6 million tonnes providing warehousing services for a wide range of products ranging from agricultural produce to sophisticated industrial products. Warehousing activities of CWC include food grain warehouses, industrial warehousing, custom bonded warehouses, container freight stations, inland clearance depots and air cargo complexes. Apart from storage and handling, CWC also offers services in the area of clearing & forwarding, handling & transportation, procurement & distribution, dis infestation services, fumigation services and other ancillary activities.
The Central Warehousing Corporation provides safe and reliable storage facilities for about 120 agricultural and industrial commodities. The areas of operations of these central warehouses include centres of all-India and inter-state importance.
The functions of the Central Warehousing Corporation are:
(i) To acquire and build godowns and warehouses at suitable places in India;
(ii) To run warehouses for the storage of agricultural produce, seeds, fertilizers and notified commodities for individuals, co-operatives and other institutions;
(iii) To act as an agent of the government for the purchase, sale, storage and distribution of the above commodities;
(iv) To arrange facilities for the transport of above commodities;
(v) To subscribe to the share capital of State Warehousing Corporations; and
(vi) To carry out such other functions as may be prescribed under the Act.
While foodgrains, sugar and fertilizers occupy 78 per cent of the total utilized storage capacity, in the remaining 22 per cent are stored cement, chemicals and other commodities. Warehouses of the corporation are fairly full all through the year.
Besides the conventional storage godowns, the Central Warehousing Corporation is running air-conditioned godowns at Kolkatta, Mumbai and Delhi, and provides cold storage facilities at Hyderabad. Special storage facilities have been provided by the Central Warehousing Corporation for the preservation of hygroscopic and fragile commodities. The Corporation has been able to evolve a technique for a proper and scientific preservation of jaggery during the hot and rainy seasons by selective aeration and controlled conditions. It has set up special warehouses at some centres for the storage of jaggery. The jaggery stored in warehouses fetches a premium price in the market. The Corporation has also evolved techniques for the storage of spices, coffee, seeds and other commodities.
The Corporation is operating a number of customs bonded warehouses at important centres in Delhi, Amritsar, Ludhiana, Kolkata, Kandla, Ahmedabad, Baroda, Surat, Bhopal, Cochin, Ernakulam and Mumbai to enable exporters/importers to keep their commodities in a good condition, pending their shipment. It has also undertaken the storage and handling of export and import cargo at the international air-port at Palam, New Delhi. At this complex, all the facilities, including inspection and clearance by customs, the payment of duty into the bank, and space for clearing agents, have been provided by the corporation. It has put up a similar air cargo complex at Amritsar for the export/import of goods. It has been expanding its capacity at the port towns to serve the industry and co-operative bodies. It has already established a sizeable capacity at Mumbai, Kolkata, Cochin, Chennai, Mangalore, Paradeep, Kandla, Haldia and Vizag.
The Corporation has introduced a scheme, called the Farmers Extension Service at selected centres to educate farmers about the benefits of a scientific storage and use of public warehouses. The Central Warehousing Corporation also provides a package of services, such as handling and transport, safety and security of goods; insurance, standardization, documentation, and other connected services and facilities.
Administrative Setup
The Corporate Office is located at "WAREHOUSING BHAWAN" 4/1 Siri Institutional Area, August Kranti Marg, New Delhi - 110016. CWC has 17 Regional Offices located in major state capitals of the country. The details of the Senior Executives is as under:
1. B.K. Saha, IAS (Retd.)
Chairman, Central Warehousing Corporation,
Tele: 91-11-26515980 Fax : 91-11-26962411
E-mail: chrmn.cwhc@nic.in ,
2. B.B. Pattanaik,
Managing Director, Central Warehousing Corporation,
Tele: 91-11-26515160 Fax : 91-11-26967844
E-mail: mdcwc@nic.in
3. G N Nair,
Director ( Finance), Central Warehousing Corporation,
Tele: 91-11-26966295, 26566107 / 103 Fax : 91-11-26534146
E-mail: gnnair.cwhc@nic.in
4. G.Mathialagan, Director ( Personnel), Central Warehousing Corporation,
Tele: 91-11-26852825, 26566107 / 104 Fax : 91-11-26850575
E-mail: dirpers.cwhc@nic.in
5. T.K. Doshi, Director (MCP), Central Warehousing Corporation,
Tele: 91-11-26967245 Telefax: 91-11-26518031
E-mail: dmcp.cwhc@nic.in
6. Vineet Pandey, Chief Vigilance Officer, Central Warehousing Corporation,
Tele: 91-11-26966219 Fax : 91-11-26964082 E-mail : cvo.cwhc@nic.in
7. Dr. S C Batra, OSD (Recovery), Central Warehousing Corporation,
Tele: 91-11-26851410 Fax : 91-11-26852248 E-mail :
8. O P Bharati, General Manager (Com), Central Warehousing Corporation,
Tele: 91-11-26967712 / 26850568, Fax : 91-11-26967712
E-mail: gmcomm.cwhc@nic.in, bharti.cwhc@nic.in
9. A V Jawakar, Secretary, Central Warehousing Corporation,
Tele: 91-11-26518013, 26566107 / 104 Fax : 91-11-26966268
Email: secycwc@nic.in
10. N K Grover, General Manager (F&A)
Central Warehousing Corporation,
Tele: 91-11-26515148, Fax : 91-11-26964082 E-mail: grover.cwhc@nic.in,
11. J V Bendre, Dy. General Manager (Per.) , Central Warehousing Corporation,
Tele: 91-11-26515178 Fax : 91-11-26967256
Our Services offered by CWC
Scientific storage and handling services for more than 400 commodities include Agricultural produce, Industrial raw-materials, finished goods and variety of hygroscopic and perishable items. Scientific Storage Facilities for more than 200 commodities including hygroscopic and perishable items through network of 487 warehouses in India with its 5,765 trained personnel. Import and Export Warehousing facilities at its 36 Container Freight Stations in ports and inland stations. Bonded Warehousing facilities , Disinfestation services Handling, Transportation & Storage of ISO Containers.
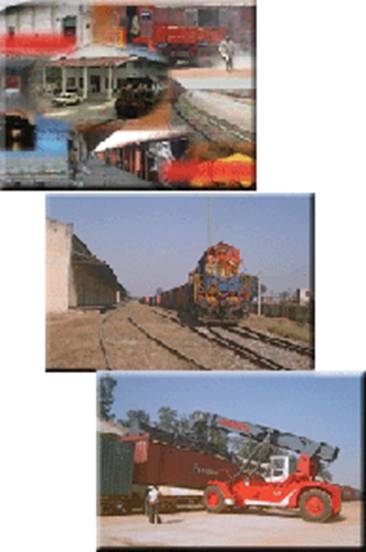
CWC’S FORAYS INTO DEVELOPMENT OF RAILSIDE COMPLEXES
Railways has vast network for not only operating passenger trains but also for freight movement, an imminent need was assessed to augment the utilization level of Railway transportation system so as to reduce the pressure on road traffic by making it cost effective and efficient operation for the trade. As such, concept of Rail Side Warehousing facilities was evolved by the Corporation as value addition to the rail transport system which extends benefits to the users in avoiding multiple handling of their stocks and resultant escapable losses on this account; curtailing handling cost and having a hassle free efficient operation. For transforming the concept into tangible shape, CWC successfully developed a pilot project of Rail Side Warehousing facility at Whitefield, Bangalore in association with South Western Railway in February 2002 and on the strength of fruitful effect of this project on the front of increase in traffic/freight revenue and the kind of satisfaction that trade enjoyed out of it on availing this value added services in the arena of rail transportation, CWC and Ministry of Railway joined their hand in the avenue of developing Rail Side Warehousing facilities at 22 strategic locations of Railway Terminal to provide better services through total logistic solution to Rail users for, not only to attract additional traffic, but also to provide a cost beneficial and efficient transport cum storage service to the trade under single window concept.
Under the purview of MoU entered between MoR and CWC, the Corporation has commenced the expansion of RWC facilities at Whitefiled, Bangalore to meet even growing demand of users. The Corporation has started construction of RWC facilities at Nishatpura (Bhopal) - West Central Railway; Shakurbasti (Delhi); Alamnagar (Lucknow); Roza (Shahjahanpur) - all under Northern Railway and Sanathnagar (Hyderabad) - South Central Railway after the agreements entered with respective Divisional Railway Managers. A subsidiary in the name of "Central Railside Warehouse Company Ltd." was incorporated on 10.07.2007, under the Companies Act 1956 which commenced its business on 24.07.2007.
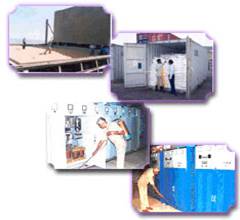
Aircargo Complexes
Ambitious expansion of CWC over the years has also brought CWC in the operation of Aircargo Complexes which is a major step towards providing complete services as a multi-modal transport operator. Presently, CWC is operating 4 Aircargo Complexes at the International Airports of Amritsar, Goa, Singanallur and Virugambakkam besides managing the accompanied/mishandled cargo warehouse at Indira Gandhi International Airport at New Delhi.

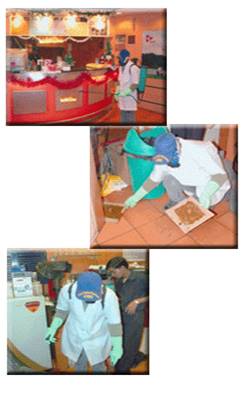
Disinfestation and Pest Control Services
Govt. of India, vide Notification dated 23rd March 1968, entrusted additional responsibility to CWC to undertake Disinfestation/Pest Control Services beyond its warehouses in respect of Agricultural produce or other notified commodities.
Over the years, CWC has developed the expertise in Pest Management in the following areas
- Rodent Control
- House hold Pest Management- Cockroaches, Mosquitoes, House Flies, Bed Bugs, Spiders, Lizards, Carpet Beetles, Fleas, Crickets, Ants, Wasps, Locusts etc.
- Storage Pest Management.
- Anti-termite treatments (Pre & Post Construction)
- Container Fumigation.
- Ship Fumigation(on Board)
- Pre-shipment fumigation of Export Cargo
- Rail Coach disinfestations
- Aircraft disinfestations
- Hospital & Nursing Homes Treatments
- Disinfestations of Hotels & Restaurants
- Disinfestations of Commercial Complexes & Office premises.
- Disinfestations of Oil Refineries
- Disinfestations of Airports & Ports
- Disinfestations of Delhi Metro Rail Premises
CWC the only organization in the public sector recognized by the Directorate of Plant Protection Quarantine and Storage, Ministry of Agriculture, Govt. of India as well as the Export Inspection Council of India to undertake Pre-shipment fumigation and Ship (on board) fumigation of exportable commodities. CWC earned a major breakthrough in disinfestation of aircrafts of Air India using timer device. CWC has thus earned the status of a National Pest Control Agency.
CWC has taken lead in accreditation of its pest control operators under newly introduced National Standards on Phytosanitary Measures NSPM 11 & 12 to facilitate MBr fumigation treatment of export/import cargo carrying wood packaging material (WPM) in compliance to the FAO/IPPC guidelines issued through International Standard on Phytosanitary Measures ISPM -15. Under this accreditation regime, the Corporation is catering to quarantine treatments at the following major centres:-
CFS-JN Port , CFS-Tuticorin (Tamil Nadu), CFS-Chennai, CFS-Adalaj (Ahmedabad), CFS-Kandla Port (Gandhidham), CFS-Vizag, CFS-Whitefield (Bangalore), CFS-Panambur (Mangalore), ICD-Patparganj (Delhi), CW-Nampally (Hyderabad), CW-Kakinada (Hyderabad), CWC-Regional Office Bhopal, CWC-Regional Office Kolkata,CW-Cochin (Hyderabad), CWC-Regional Office- Mumbai.
Major clients of CWC for pest control services include:-Many leading grain exporters, shippers for containerized cargo, Indian Railways, Air India, Air Sahara, Air Deccan, Indian Airlines, Jet Airways, Airport Authority of India, Indian Oil Corporation, GAIL (India) Limited, Reserve Bank of India, AIIMS, Central Public Works Department, VSNL, ONGC, AIR etc
Pre-shipment fumigation and ship fumigation facilities are offered at the following ports:- Mundra, Kandla, Jamnagar, Pipavav, Mangalore / Karwar, Tuticorin, Visakhapatnam, Kakinada, Kolkata, Haldia, Navi Mumbai, Port Blair.
Some of the Grain exporters who have availed CWC’s pest control services during the recent past include:-
Satnam Overseas, Cargill India Ltd., Adani Exports Ltd., MMTC, PEC, STC, Vicnivas Agencies, PUNSUP, Seaways, Bishan Swaroop Ram Kishan Agro, Olam International, LMJ International, SS Exports, V. Arjun, Vishal Exports, Ruchi Soya, VASS Exports, CWC also takes POD guarantee for off-loading pest free cargo at the foreign destinations (country of import) at a nominal cost in addition to the usual fumigation charges.
CWC is keen to enter into agreements with users for providing Pest Control Services as well as Strategic Alliance with other pest control service providers/firms dealing with pest control related activities for further widening its clientele.
Pest Control Information Please contact:
Mr. Sher Jagjit Singh, Dy. General Manager, (Pest Control Services)
Central Warehousing Corporation, 4/1, Siri Institutional Area,
August Kranti Marg, Hauz Khas, New Delhi-110016.
Telefax: 011-26862977 Mobile: 9891937407 e-mail: cwcpcs07@gmail.com>
(c) State Warehousing Corporations (SWCs)
Separate warehousing corporations were also set up in different States of the Indian Union. The first state warehouse was set up in Bihar in 1956. At the end of March 2001, State Warehousing Corporations were operating 1440 warehouses with a total capacity of over 131.38 lakh tones.
The area of operation of the State Warehousing Corporations are centres of district importance. The total share capital of the State Warehousing Corporations is contributed equally by the concerned State Governments and the Central Warehousing Corporation. The SWCs are under the dual control of the State Government and the Central Warehousing Corporation.
Working of Warehouses
Acts: The warehouses (CWC and SWCs) work under the respective Warehousing Acts passed by the Central or State Governments. They are lincensed under the provisions of the Act.
Eligibility: Any person may store notified commodities in a warehouse on agreeing to pay the specified charges. The person is required to bring his produce to the warehouse for storage. The commodity is inspected, and the quality of the product is determined.
Warehouse Receipt (Warrant): This is a receipt/warrant issued by the warehouse manager/owner to the person storing his produce with them. This receipt mentions the name and location of the warehouse, the date of issue, a description of the commodities, including the grade, weight and approximate value of the produce based on the present price.
The warehouse warrant is a negotiable instrument and can be transferred by a simple endorsement and delivery. A delivery of part of the goods may be taken through this warrant by the depositor. Sometimes, the warrant may be non-negotiable.
Use of Chemicals: The produce accepted at the warehouse is preserved scientifically and protected against rodents, insects and pests and other infestations. Periodical dusting and fumigation are done at the cost of the warehouse in order to preserve the goods.
Financing: The warehouse receipt serves as a collateral security for the purpose of getting credit. Commercial banks advance up to 75 per cent of the value of the produce stored in the warehouse.
Delivery of Produce: The warehouse receipt has to be surrendered to the warehouse owner before the withdrawal of the goods. The holder may take delivery of a part of the total produce stored after paying the storage charges.
The main provisions of the Act governing the grant of a license to run warehouses were: (a) Any person, including a company, association or corporate body may apply to the State Government for the grant of a license to carry on the business of warehousing.
(b) The government grants the license after examining the warehouse building and the financial soundness of the party, and after the realization of the prescribed fees.
(c) The license has to be renewed periodically on payment of prescribed fees.
(d) The warehouse owner is authorized to receive only notified commodities for storage in his warehouse and issue receipts in a prescribed form.
(e) It is the responsibility of the warehouse owner to keep the premises clean, keep different lots of goods separately in the warehouse, and carry on such operations as are necessary to protect the goods against losses from damage and pilferage.
Number and Capacity of Warehouses
The Government, the Food Corporation of India, Co-operative Marketing Societies and Central and State Warehousing Corporations have taken important measures for the creation of warehousing facilities in the country. As a result, a large number of warehouses/godowns have been built throughout the country in all important rural and urban centres, metropolitan cities, ports and railway stations.
(a) Central and State Warehousing Corporations (CWC and SWC)
The number and capacity of warehouses of CWC and SWC in the country at different points of time have been given in Table 7.1.
Table 7.1
Number and Capacity of Warehouses in India (including hired)
Year |
Number |
Capacity in Lakh Tonnes |
||||
|
CWC |
SWC |
Total |
CWC |
SWC |
Total |
1957-58 |
7 |
- |
7 |
0.07 |
- |
0.07 |
1960-61 |
40 |
266 |
306 |
0.79 |
2.78 |
3.57 |
1970-71 |
102 |
601 |
703 |
8.36 |
18.11 |
26.47 |
1980-81 |
330 |
1050 |
1380 |
37l89 |
50.00 |
87.89 |
1990-91 |
495 |
1331 |
1826 |
66.48 |
93.54 |
160.02 |
1992-93 |
465 |
1350 |
1815 |
64.41 |
90.74 |
155.15 |
1993-94 |
458 |
1364 |
1822 |
63.73 |
95.58 |
159.31 |
1994-95 |
457 |
1370 |
1827 |
64.31 |
101.72 |
166.03 |
1995-96 |
458 |
1371 |
1829 |
69.24 |
114.71 |
183.95 |
199-00 |
451 |
1440 |
1891 |
74.79 |
123.74 |
198.53 |
2000-01 |
466 |
1639 |
2105 |
83.91 |
148.99 |
232.90 |
2001-02 |
475 |
1540 |
2015 |
89.17 |
815.49 |
274.66 |
Considerable efforts were made to increase the storage capacity in the country. The number of warehouses, which had increased from only seven during 1957-58, to 306 during 1960-61, and 703 during 1970-71, went up to 1380 during 1980-81 and further to more than 2000 during 2001-02. The total capacity of warehouses which was almost negligible during 1957-58 went up to 275 lakh tones at the end of March 2002. Out of the total storage capacity of 275 lakh tones, nearly 89 lakh tones was with the Central Warehousing Corporation and remaining 186 lakh tones with State Warehousing Corporations.
The number of commodities stored in the warehouses has steadily increased. These include foodgrains, fibre crops, fertilizer, cement, rubber, cotton yarn, textiles, paper and leather.
Food Corporation of India
An efficient management of the food economy with a view to ensuring an equitable distribution of food grains at reasonable prices to the vulnerable sections of society is essential in the present socio-economic environment of the country. The government felt the necessity of an organization which can act as its main agency for handling food grains, acquire a commanding position in the food grain trade as a countervailing force to the speculative activities of private traders and, at the same time, work on commercial lines. Towards the end of 1964, Parliament decided to transfer the government's function of trading in food grains to the public sector. Legislation was enacted; and the Food Corporation of India (FCI) was born on January 1, 1965.
OBJECTIVES
- Effective price support operations for safeguarding the interests of the farmers.
- Distribution of food grains throughout the country for public distribution system
- Maintaining satisfactory level of operational and buffer stocks of food grains to ensure National Food Security
In its 45 years of service to the nation, FCI has played a significant role in India 's success in transforming the crisis management oriented food security into a stable security system. FCI's Objectives are:
- To provide farmers remunerative prices
- To make food grains available at reasonable prices, particularly to vulnerable section of the society
- To maintain buffer stocks as measure of Food Security
- To intervene in market for price stabilization
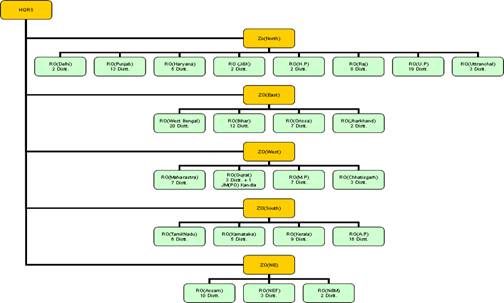
OPERATIONAL NETWORK
FCI operates through a country-wide network with its Corporate Office in New Delhi, 5 Zonal Offices, 23 Regional Offices practically in all the State capitals, 165 District Offices(as on 01.10.2008) and 1470 depots (as on 01.01.2007). Most of the Revenue Districts in the country are covered by FCI. It has a manpower of 33,473 officers and staff /employees as on 31.03.2010 and about 53,646 regular food handling workers besides approximately one lakh food handling contract labourers being engaged by the Handling & Transport Contractors, as on 31.03.2010. The general superintendence, direction and management of the affairs and business of the Corporation shall vest in a board of directors which exercise all such powers as may be exercised or done by the Corporation under this Act. The board of directors, in discharging its functions, act on business principles having regard to the interest of the producer and consumer and shall guided by such instructions on questions of policy as may be given to it by the Central Government.
Today, the FCI is the unrivalled food marketing agency, serving the interests of both the farmers and consumers. Its market operations prevent the speculative trader from acting against the interest of the farmer by assuring him a remunerative price for his produce. It ensures a prompt and uninterrupted supply of food grains to the vulnerable sections of society all over the country. Operationally, the FCI reaches the remotest corners of the country through its vast network of offices and storage centres. Financially, it is one of the largest public sector undertakings, with an annual turnover of over Rs.25400 crores.
Functions
The main functions of the Food Corporation of India are:
(a) To procure a sizeable portion of the marketable surplus of foodgrains and other agricultural commodities at incentive prices from the farmers on behalf of the Central and State Governments;
(b) To make timely releases of the stocks through the public distribution system (fair price shops and controlled items shops) so that consumer prices may not rise unduly and unnecessarily;
(c) To minimize seasonal price fluctuations and inter-regional price variations in agricultural commodities by establishing a purchasing and distribution network; and
(d) To build up a sizeable buffer stock of foodgrains to meet the situations that may arise as a result of shortfalls in internal procurement and imports.
Growth and Structure
The Corporation discharges its responsibility to the nation through a country wide network of offices and points of contact, it is divided into five zones, each region generally coinciding with the geographical boundary of a State. Each region has district offices. The Corporation now has five zonal offices, 19 regional offices, four sub-regional offices, four offices of Joint Managers (operations), 173 district offices, and thousands of operating points throughout the country for its purchase and distribution operations.
Organisational Structure of FCI
The tremendous growth of the organization is the direct result of the staggering increase in the volume of its business. The progress of the FCI in various areas may be assessed from the following:
(i) Procurement
The Food Corporation of India undertakes the procurement of food grains on behalf of the Government of India and State Governments in the States where it has been entrusted with this responsibility either as a sole agency or jointly with other public procurement agencies. It also undertakes massive price support operations for cereals on behalf of the Central and State Governments to protect the interests of the growers. It prevents distress sales by ensuring to the farmers, predetermined procurement/support prices. It also handles huge stocks of food grains procured by other agencies for the central pool, and utilizes the services of co-operative societies to the maximum extent possible.
The Food Corporation of India purchases food grains from producers during both the seasons, directly or through the agency of co-operatives or purchasing agents, and from millers under various arrangements of procurement determined by different State Governments. The quantities procured in different years by the Food Corporation of India are given in Table 7.2. A glance at the procurement of food grains by the Corporation would show the vital and effective role it has played in the national economy. Commercial purchases of some commodities, viz., cereals and pulses, are also made by the Corporation at market prices with a view to supplying them to the defense services.
Table 7.2
Procurement of Food grains by Food Corporation of India
(thousand tones)
Calendar year |
Rice |
Wheat |
Coarse grains |
Total |
1965 |
2951 |
375 |
705 |
4031 |
1970 |
3043 |
3183 |
488 |
6714 |
1975 |
5042 |
4098 |
423 |
9563 |
1980 |
5210 |
5866 |
102 |
11178 |
1985 |
9568 |
10355 |
184 |
20107 |
1990 |
12792 |
11094 |
105 |
23991 |
1995 |
9997 |
12327 |
- |
22324 |
1995-96* |
10047 |
12327 |
- |
22374 |
1996-97* |
12960 |
8157 |
- |
21117 |
1997-98* |
15486 |
9298 |
- |
24784 |
1998-99* |
12590 |
12652 |
- |
25242 |
1999-00* |
18207 |
14143 |
- |
32350 |
2000-01* |
20824 |
16356 |
- |
37180 |
2001-02* |
22129 |
20630 |
- |
41910 |
2005-06 |
14785 |
27656 |
1154 |
43595 |
2006-07 |
9226 |
25107 |
0.20 |
34333 |
2007-08 |
11127 |
28491 |
203 |
39821 |
2008-09 |
22682 |
33683 |
1375 |
57740 |
2009-10 |
25382 |
23687** |
320** |
49389** |
*Figures are for marketing year (October-September for rice and April-March for wheat)
Source : (i) Govt. of India, Department of Food, New Delhi.
(ii) Govt. of India, Agricultural Statistics, At a Glance, 2002 and 2003, New
Delhi.
(iii) ** As on 8.3 2010
(ii) Storage
The provision of adequate and proper scientific storage facilities for food grains from the time of procurement till their distribution is another important function performed by the Corporation. Its responsibility for storage has increased with the transfer to it of the responsibility for building up a buffer stock by the government. Food grains are stored in go downs which are scientifically constructed for protection against dampness, rats and fungus.
Till the beginning of 1968, there had been a more or less complete ban on the construction of new go downs. With the onset of the green revolution, there was an urgent necessity of augmenting substantially the storage facilities for food grains at the production and consumption centres. The Corporation, therefore, launched a crash programme for the construction of go downs. It also encouraged private parties to construct modern food grain go downs on a guaranteed occupation basis. Constant and effective inspection and treatment of food grains in storage ensures that the stocks are kept in good condition. New and cheap methods for the preservation of stocks have been developed by the technical experts of the Corporation. Storage losses in FCI go downs have been brought down to less than one per cent as against its former very high percentage loss (up to 10%). The activities undertaken by the FCI for this purpose are:
(a) It has constructed 28.30 million tones of storage capacity – well-built go downs, silos and CAP (Cover and Plinth) located at strategic points near the production and consumption centres and major ports. CAP storages are in large open areas and are scientifically planned to hold thousands of bags of grains under polythene covers.
(b) The FCI has taken over the construction of silos in order to switch over to the bulk handling and storage of food grains in a phased manner. Silos are tall and massive structures with huge storage facilities and facilities for mechanical handling. As a result, the losses arising out of handling are reduced. As a result, the losses arising out of handling are reduced. Handling charges, too, are brought down. The construction of silos has been taken up in Punjab, Haryana, Uttar Pradesh and Delhi.
(c) The FCI uses air strips, army barracks and former palaces for the storage of food grains during the massive procurement season.
(d) The FCI has a chain of 138 quality control laboratories which develop quality control measures to ensure the safe storage of food grains. In addition, scientists, technicians and workers air, rotate and fumigate stocks at regular intervals so that quality does not deteriorate.
Storage Capacity with FCI
( in Million Tonnes as on 1st April)
Capacity. 2003 2004 2005 2006 2007 2008 2009 |
Covered |
Owned 12.82 12.82 12.91 12.93 12.94 12.95 12.97 |
Hired 13.77 10.85 10.46 9.90 9.34 8.71 12.01 |
Total 26.59 23.67 23.37 22.83 22.28 21.66 24.98 |
CAP ( Cover and Plinth) |
Owned 2.26 2.21 2.25 2.21 2.29 2.20 2.31 |
Hired 2.88 1.36 0.41 0.51 0.63 0.03 0.42 |
Total 5.14 3.57 2.66 2.72 2.92 2.23 2.73 |
Grand Total 31.73 27.24 26.03 25.55 25.20 23.89 27.71 |
(iii) Transportation
The Food Corporation of India organizes swift and massive movement of food grains, both by rail and road, to ensure timely arrivals in the areas of consumption and of storage. This activity of the Corporation enables it to maintain a steady public distribution system – from the procurement centres and the ports to the areas of consumption and storage without any serious difficulty. It is one of the largest users of the railways. The quantity transported by rail and road during 1966-67 was 1.238 million tones, which increased to an average of more than 20 million tones during the last five years.
(iv) Imports
The Food Corporation of India handles the entire quantity of imported foodgrains at all major ports. This responsibility was entrusted to it by the government in 1969-70. The imported food grains are speedily dispatched to various destinations to avoid congestion at the ports and to augment supplies to the public distribution system.
(v) Distribution
Another important function of the Corporation is the distribution of procured/ imported food grains through nearly 4.91 lakh fair price shops all over India. Food grains are issued on the basis of the allocations made by the Central Government. The Food Corporation of India makes food grains available to the vast majority of population at reasonable prices. The quantity of food grains distributed through public distribution and open sales has varied between 17.4 to 25.8 million tones during the last 5 years.
(vi) Processing
The Food Corporation of India has made notable strides in the field of food processing. It has acted as a pace-setter in the modernization of food processing operations. It has set up 24 modern rice mills in different States to increase the availability of rice and extract oil from rice bran. It has also set up a Paddy Processing Research Centre at Tiruvarur in Tamil Nadu in collaboration with the Government of Tamil Nadu and the Union Ministry of Agriculture with a view to evolving a new technology for increasing the outturn of rice at rice mills, better utilization of bran for the extraction of edible oil and proper use of by products. A solvent extraction plant at Sembanarkoil (Tamil Nadu) has also been set up for the manufacture of edible and industrial grade oil from rice bran. These have served as models for private interests in this line to set up such mills elsewhere.
The Corporation has set up paddy dryers in Thanjavur district in Tamil Nadu and a maize dryer at Khanna in Punjab to dry the grain and transport it to other districts without any damage by quick sprouting diseases which break out because of high moisture content. The FCI has also set up a solvent extraction plant at Ujjain (M.P.) to process groundnut. The FCI has set up a maize mill at Faridabad (Haryana) to manufacture a variety of maize products. It has set up a dal mill at Lucknow (U.P.) to meet the purchase requirements of the army.
The FCI also produces (about 40,000 tonnes per annum) a protein-rich food (Balahar), a midday meal for school children, Balahar is a mix of wheat flour, groundnut meal, vitamins and minerals.
(vii) Consultancy
The Food Corporation of India has taken a new function of consultancy service, and provides technical and scientific assistance to other public and private undertakings as well as co-operatives in the country and abroad. The consultancy service offers assistance in the modernization of rice and dal mills and other agro-processing units. The service includes the conduct of feasibility and technoeconomic studies, management systems and optimization studies, and market surveys.
(viii) The corporation also collects and manages levy sugar on behalf of the government of India.
Buffer Stocking, Procurement and Distribution of Food grains
Buffer Stocks
The term buffer stock of food grains refer to the stock of food grains maintained by the government to be used as a buffer to cushion the shocks of fluctuating supply and price, to meet the emergency needs and to meet the situations arising out of serious unexpected shortages resulting from transport bottlenecks, natural calamities like war, flood, famine, earthquakes, and from the influx of refugees.
The main advantages of maintaining a buffer stock are:
(i) It helps in the stabilization of prices by counteracting the effects of the activities of speculators and hoarders;
(ii) It safeguards the producers against low prices, specially during the surplus-production years; and
(iii) It imparts stability to the country's food economy.
The government enters the market and purchases food grains for the maintenance of the buffer stock. This buffer stock can be built either by internal purchases or by imports from foreign countries. It is maintained by the Food Corporation of India and has averaged more than 10 million tones annually since 1976, as against a normal stock of less than 5 per cent tones before that year. After 5 years of a very comfortable position in food grains, the year 1981 witnessed some tightening in the supply position. The all-time record off take of 14.9 million tones in 1980, the relatively low procurement of 11.2 million tones, and the estimated exports of 2 million tones of food grains in repayment of a wheat loan led to a sharp decline in the size of stocks. The procurement of wheat boosted the food grains stocks to 13.5 million tones by the end of July 1981. These stocks, though adequate, were well below the level during the five years from 1976 to 1980.
In mid-eighties, a buffer stock of 10 million tones comprising 5 million tones of wheat and equal quantity of rice was considered adequate. It should be noted that this buffer stock is over and above the operational stocks. Considering both together, a stock of around 20 million tones was considered necessary for a country of India's size. However, the stock, which can be considered optimum, depends on the level of public distribution of food grains intended by the government. On July 1, 1990, the food rains stock with the government of India was 20.3 million tones. But on the same day, a year before (July 1, 1980), the stock was only around 13 million tones.
Apart from CWC and SWCs, the Food Corporation of India has also created storage facilities. The Food Corporation of India has a storage capacity of 21 million tones. Most of the capacity is of covered type which include conventional but scientifically designed godowns and silo complexes but a part of the storage capacity is of covered and plinth (CAP) type. The CAP storage capacity consists of cemented floor as the base and tarpaulins or other similar sheets as the cover (Table 7.3).
At the end of |
|
Covered |
Cover and Plinth (CAP) |
Total |
1990-91 |
Owned |
119.97 |
10.42 |
130.39 |
|
Hired |
75.95 |
14.74 |
90.69 |
|
Total |
195.92 |
25.16 |
221.08 |
1995-96 |
Owned |
168.24 |
57.66 |
225.90 |
|
Hired |
40.29 |
- |
40.29 |
|
Total |
208.53 |
57.66 |
266.19 |
2001-02 |
Owned |
126.10 |
83.38 |
209.48 |
|
Hired |
141.07 |
- |
141.07 |
|
Total |
267.17 |
83.38 |
350.55 |
PROCUREMENT OF RICE FOR CENTRAL POOL
(Figures in lakh tonnes)
Year FCI State Agencies Total |
2005-06 109.77 166.80 276.56 |
2006-07 168.85 81.90 250.75 |
2007-08 124.28 160.65 284.93 |
2008-09 27.63 309.22 336.85 |
2009-10* 10.55 143.07 153.62 |
PROCUREMENT OF RICE (INCLUDING PADDY IN TERMS OF RICE)
Total Procurement during KMS 2009-10 = 153.62
Total Procurement during KMS 2008-09 = 152.00
2009-10 2008-09 |
State Quantity % of Quantity Procured Quantity % of Quantity Procured |
Andhra Pradesh 9.01 5.87 14.80 9.74 |
Chhattisgarh 11.28 7.34 10.21 6.72 |
Haryana 18.03 11.74 13.75 9.05 |
Madhya Pradesh 0.40 90.26 90.61 90.40 |
Procurement of Rice (Including Paddy in terms of rice) During KMS 2008-09 (in lakh tonnes) to Total Procurement Andhra Pradesh 90.61 26.90 Chhatisgarh 28.48 8.45 Haryana 14.25 4.23 Madhya Pradesh 2.45 0.73 Maharashtra 2.61 0.77 Orissa 27.90 8.28 Punjab 85.53 25.39 Tamilnadu 11.99 3.56 Uttar Pradesh 36.87 10.95 Uttarakhand 3.49 1.04 Total 304.18 90.30 Others 32.67 9.70 Grand Total 336.85 100.00
for the Central Pool Total procurement = 336.85 lakh tonnes
State Quantity Procured % of Quantity Procured
The share of procurement of paddy by State Agencies out of the total procurement during KMS 2009-10(31.12.09) and 2008-09 in major States has been as under: -
State Quantity Procured % of Quantity Procured by (In Lakh Tonnes) State Agencies to Tota |
Agencies FCI State Agency Total % of state agency to others in the state |
Andhra Pradesh 0.18 0.19 0.37 51.35 |
Chhatisgarh 3.48 3.48 100.00 |
Madhya Pradesh 0.12 0.12 100.00 |
Maharashtra 0.29 0.29 100.00 |
Orissa 0.06 0 0.06 0.00 |
Punjab 6.69 131.15 137.84 95.15 |
Tamilnadu 0.33 0.33 100.00 |
Uttar Pradesh 1.44 1.44 100.00 |
Uttarakhand NEG 0.05 0.05 100.00 |
Total 7.35 162.82 170.22 95.65 |
Others 0.21 1.09 1.30 83.85 |
Grand Total 7.56 163.96 171.52 95.59 |
The State-wise procurement of wheat and the share of different States during the last 5
years is given below:-
Total Paddy procured during KMS 2009-10 (As on 31.12.2009)
State Quantity Procured % of Quantity Procured by |
(In Lakh Tonnes) State Agencies to Total |
FCI State Total |
Andhra Pradesh 0.18 0.19 0.37 51.35 |
Chhatisgarh 3.48 3.48 100.00 |
Haryana 0.42 25.82 26.24 98.40 |
Madhya Pradesh 0.12 0.12 100.00 |
Maharashtra 0.29 0.29 100.00 |
Orissa 0.06 0.06 0.00 |
Punjab 6.69 131.15 137.84 95.15 |
Tamilnadu 0.33 0.33 100.00 |
Uttar Pradesh 1.44 1.44 100.00 |
Uttarakhand NEG 0.05 0.05 100.00 |
Total 7.35 162.82 170.22 95.65 |
Others 0.21 1.09 1.30 83.85 |
Grand Total 7.56 163.96 171.52 95.59 |
Position as on 31.12.09
Procurement made by the State Agencies
State 2005-06 2006-07 2007-08 2008-09 2009-10 |
Haryana 45.29 22.29 33.50 52.36 69.24 |
M.P. 4.84 Neg 0.57 24.09 19.68 |
Punjab 90.10 69.46 67.81 99.40 107.25 |
Rajasthan 1.59 0.02 3.83 9.35 11.50 |
U.P. 5.60 0.49 5.46 31.37 38.80 |
Others 0.43 0.00 0.11 10.32 7.35 |
All India 147.85 92. 26 111.28 226.89 253.82 |
(c) Co-operative Sector
The co-operative sector has also built a storage capacity of 13.55 million tones up to March 2002. The co-operatives have also constructed 175 cold storage warehouses with a total capacity of 2.14 lakh tones. The National Co-operative Development Corporation had helped in contracting 55988 rural godowns and 9363 cooperative marketing godowns by the end of March, 2002. These co-operative godowns are used by the Food Corporation of India in times of need, and provide a readily available cushion when the procurement of foodgrains is at peak.
The spatial distribution of CWC, SWC, FCI and Cooperative marketing societies godowns constructed in the country is uneven across states with relatively poor storage facilities in the eastern states of the country. The available storage facility is also poor in the hilly and desert areas.
Storage Capacity Available in India 2000-01
(Million Tonnes)
Storage Capacity Created by the Agency |
Storage capacity (owned) |
||
1969 |
March 2001 |
||
1. |
Food Corporation of India and Department of Food |
3.68 |
15.0 |
2. |
State Governments |
2.66 |
- |
3. |
Central Warehousing Corporation (CWC) |
0.96 |
6.5 |
4. |
State Warehousing Cooperations |
0.83 |
11.2 |
5. |
Cooperatives |
2.60 |
13.6 |
6. |
Rural Godowns and Godowns Created by Marketing Societies |
- |
13.5 |
7. |
Others |
- |
10.3 |
|
Total Storage Capacity |
10.91 |
70.1 |
(ii) Report of the Expert Committee on Strengthening and Developing of Agricultural Marketing, Ministry of Agriculture and Cooperation, Government of India, New Delhi, June 2001.
(iii) Planning Commission, Tenth Five Year Plan (2002-07), pp.548.
(d) Total Storage Capacity in India
There are three main agencies, which are involved in the creation of storage facility in the public sector in the country viz., Food Corporation of India, Central Warehousing Corporation and State Warehousing Corporations. Cooperative Marketing Societies also provide storage facilities at the primary marketing level. Recently rural godowns have also been constructed in rural areas under the Gramin Bhandaran Yojana initiated by the Government of India.
Total storage capacity available in India is shown in Table 4.14.
Total storage capacity available in the country in 1969 was only 10.9 million tones. This has increased in 70.1 million tones in 2000-01. However, this is considerably short of the requirements. The available storage capacity is sufficient only for 30 per cent of total foodgrains production provided cent per cent of the available capacity is utilized only for the storage of foodgrains. Private sector has also created facilities for storage of agricultural commodities nearby their place of business but most of these storage structures are unscientific and are located in the congested lanes of cities/towns. Union Budget 2010 of India announced that deficit in the storage capacity would be met through an ongoing scheme for private sector participation – FCI to hire godowns from private parties for a guaranteed period of 7 years.
The storage plan of the Ministry aims at providing the capacity required for buffer and operational stock of food grains to maintain the public distribution system and general warehousing.. The Board approach is to provide scientific storage capacity and reduce dependence on the capacity under cover and plinth. The Ministry has also been making efforts to improve the traditional storage practices in vogue at the farm level.
Food grain Storage and General Warehousing there are three agencies in the public sector which are engaged in building large scale storage/warehousing capacity namely. Food Corporation of India (FCI) Central Warehousing Corporation (CWC) and 17 State Warehousing Corporation (SWCs). Over a period of time sizeable scientific storage/warehousing capacity has been developed by these public sector agencies and they are implementing plans to increase it further. While the capacity available with FCI is used mainly for storage of food grains that with CWC and SWCs is used for storage of food grains as well as certain other items.
Table 7.5
Storage capacity of FCI , CWC and SWCs 01.02.2010
(Figure in lakh MT)
State FCI CWC SWC Grand Total |
Andhra Pradesh 37.87 15.87 19.33 73.07 |
Arunachal Pradesh 0.22 0.00 0.00 0.22 |
Assam 2.71 0.65 2.50 5.86 |
Bihar 6.71 1.24 2.65 10.60 |
Chhatisgarh 8.28 2.79 8.33 19.40 |
Delhi 3.67 1.51 0.00 5.18 |
Goa 0.15 0.41 0.00 0.56 |
Gujrat 6.62 7.95 1.52 16.09 |
Haryana 23.44 5.07 16.81 45.32 |
Himachal Pradesh 0.25 0.07 0.00 0.32 |
Jammu & Kashmir 1.29 0.00 0.00 1.29 |
Jharkhand 1.20 0.35 0.00 1.55 |
Karnatka 8.44 6.70 9.18 24.32 |
Kerala 5.37 1.23 2.02 8.62 |
Madhya Pradesh 10.56 5.36 18.86 34.78 |
Maharashtra 19.18 16.98 13.66 49.82 |
Manipur 0.20 0.00 0.00 0.20 |
Meghalaya 0.26 0.00 0.11 0.37 |
Mizoram 0.23 0.00 0.00 0.23 |
Nagaland 0.28 0.13 0.00 0.41 |
Orissa 6.60 3.16 4.09 13.85 |
Rajasthan 15.53 3.99 7.67 27.19 |
Punjab 69.76 6.69 52.07 128.52 |
Sikkim 0.11 0.00 0.00 0.11 |
Tamilnadu 9.70 6.32 6.37 22.39 |
Tripura 0.51 0.24 0.00 0.75 |
Union Territories 3.51 0.22 0.00 3.73 |
Uttar Pradesh 26.55 11.65 32.60 70.80 |
Uttara Khand 2.38 0.71 0.00 3.09 |
West Bengal 11.10 6.38 2.50 19.98 |
Grand Total 282.68 105.67 205.24 588.62 |
The capacity of the FCI includes101.08 lakh MT capacity hired from the CWC and SWCs. Details of the Storage capacity constructed by FCI and CWC over years are given.
Agency 2002-03 2003-04 2004-05 2005-06 2006-07 2007-08 2008-09 |
FCI 0.94 1.32 0.97 0.23 0.20 0.17 0.02 |
CWC 3.59 2.98 1.17 2.78 3.78 2.40 0.54 |
Total 4.53 4.30 2.14 3.01 3.98 2.57 0.56 |
Capital Structure
The authorized share capital of the Corporation is Rs.100.00 crores. There has been no change in the Corporation’s subscribed share capital and the paid up share capital during 31.03.2009 is Rs.68.02 crores.
Physical Performance
Growth in Storage Capacity
As would be seen from the following table 7.6 below, the owned warehousing capacity with the Central Warehousing Corporation has grown over the years.
Table 7.6
Owned and Hired Warehousing Capacity with CWC
(in Lakh Tonnes)
As on Owned Hired Total |
31.03.2000 54.47 20.32 74.79 |
31.03.2001 56.12 27.79 83.91 |
31.03.2002 58.89 30.28 89.17 |
31.03.2003 63.53 27.61 91.14 |
31.03.2004 65.46 28.70 94.16 |
31.03.2005 66.57 35.29 101.86 |
31.03.2006 66.61 33.77 100.38 |
31.03.2007 66.99 35.21 102.70 |
31.03.2008 67.63 31.15 98.78 |
31.03.2009 67.60 37.65 105.25 |
01.02.2010 67.91 38.56 106.47 |
Capacity Utilisation
The average utilization of the Warehousing Capacity of the Corporation during the year 2009-10 has been to 86 % upto 01.02.2010).
Diversification
Over the years, the Corporation had diversified its activities.. As on 31.03.2009 it had 75 Custom Bonded Warehouses & ( as on 01.02.2010 72 Custom Bonded Warehouses.) To cater to the needs of export trade it is operating Air Cargo Complexes at Amritsar, Goa , Singanallur and Virugambakkam , Truck Terminal at a land custom station at Petrapole on Indo Bangladesh Border . Holds a Category – I Pan India license to operate container trains . The CWC is also operating 36 Inland Container Deport ICD/Container Freight Station (CFS)
FINANCIAL PERFORMANCE
Turnover Profit and Dividend The turnover increased from RS 255.64 crores in the year 1998-99 to RS 849.25 crores during the year 2008-09 . The Corporation has been consistently earning profits and paying dividends to the Government of India and other stakeholders. The Corporation has been making profits and paying dividends consistently.
Receipts for Food Corporation of India in Rs. crores 1998-99 255.64 41.50 4.49 3.67 8.16 2000-01 276.34 48.30 4.49 3.67 8.16 2001-02 339.86 73.33 7.49 6.11 13.6 2002-03 379.94 90.72 7.49 6.11 13.6 2003-04 471.08 47.62 4.12 3.36 7.48 2004-05 522.87 60.42 4.50 3.65 8.15 2005-06 619.5 71.00 7.86 6.40 14.26 2006-07 686.44 133.80 10.10 8.23 18.33 2007-08 778.23 154.76 11.23 9.14 20.37 2008-09 849.25 110.44 11.23 9.16 20.39
Year Turnover Net Profit( Pre-tax) Central Govt. Others Total
Internal Resources
The Corporation has been generating internal resources which have grown significantly over the years and are sufficient for funding its own storage construction programmed as well as contributing to the State Warehousing Corporation equity.
The Central Warehousing Corporation has 17 associates in the State Warehousing Corporations offers with operated capacity 315.25 Lakh MTs at 1993 locations . The Total investment of the Central Warehousing Corporation, is Rs. 60.12 crores shareholder in the equity of State Warehousing Corporation as on 31.03.09. The State Warehousing Corporation paid a total dividend of Rs. 268.88 crores to the Central Warehousing Corporation during 2008-09 .
The cover storage capacity available with the State Warehousing Corporation is given in following table.
(in Lakh Tonnes)
As on Owned Hired Total |
31.03.2000 82.20 41.54 123.74 |
31.03.2001 105.80 41.33 147.13 |
31.03.2002 104.28 58.50 182.78 |
31.03.2003 151.55 47.76 199.31 |
31.03.2004 158.05 48.76 206.81 |
31.03.2005 128.84 66.36 195.20 |
31.03.2006 127.64 69.41 197.05 |
31.03.2007 119.55 72.65 192.20 |
31.03.2008 124.27 63.05 187.32 |
31.03.2009 126.30 70.52 196.82 |
01.02.2010 133.08 72.16 205.24 |
Utilization of Warehousing Capacity
The utilization of warehousing capacity of the Central Warehousing Corporation was only 42 per cent in 1959-60, which increased over time to 96 per cent in 1970-71. The utilization of the capacity of State Warehousing Corporations increased from 64 per cent in 1960-61 to 75 per cent in 1968-69. At present, about 85 per cent of their storage capacity is being utilized. Of the total storage capacity with CWC, 57 per cent is utilized for foodgrains, seven per cent for fertilizers and 36 per cent for other purposes. But the available storage capacity, is mostly utilized by traders or public agencies. A study has indicated that only 29 per cent of the warehousing capacity of the Central Warehousing Corporation and six per cent of that of State Warehousing Corporations was utilized by farmers or their cooperatives.
The main reasons for the very low utilization of warehouses by farmers are:
1. Lack of knowledge about the facility of warehousing available for the farmers;
2. Locational disadvantages for warehouses to most of the cultivators located in villages;
3. Complicated and time-consuming procedure of depositing and withdrawing the produce from the warehouses;
4. Non-existence of nationalized banks in villages and the problem of arranging finance at the time of taking delivery of the receipt from the bank; and
5. Small quantity of surplus produce available with most farmers, and the pressing need for finance.
These apart, there are some fundamental factors responsible for lower use of warehouses and consequent slow progress in rural areas.
Causes of slow progress
The following are the main causes of the slow progress of warehousing in the agricultural sector in India:
(i) Indian farmers are small landowners. Obviously, the marketed surplus available with them in small. Often, it is not worthwhile for them to store the produce in a warehouse;
(ii) Indian agriculture is largely dependent on the monsoon and occasional failures of crops in one or another part of the country are common resulting in lack of regular business for the warehousing;
(iii) Agricultural products are more perishable than industrial products;
(iv) Agricultural commodities are heterogeneous. Their grading is, therefore, essential before placing them in a warehouse. This facility is not available in most of the markets;
(v) The warehouses are located in urban centres, near railway stations and big cities. The transport facility from the villages to these centres is not easily available;
(vi) The cost of warehousing per unit of the produce is high;
(vii) Warehouse receipts are papers having no intrinsic value, unless the lenders are sure that these receipts are backed by tangible assets. Often, the lenders are not interested in lending against this collateral security.
In this context, it must be recognized that storage of the produce is at a cost. It is not only the charges of the warehouse that are to be paid but also the interest on the value of the produce and the premium for risk of a lower price at a later date are to be met. With the prevailing rate of interest, the interest component of the storage cost is no less significant. Moreover, the intra-year price rise may not cover the entire cost of storage every year. The probability of returns from storage being positive is not one. This means that the gains from storage depend on the decision on the timing of the purchase and sale. This necessitates acumen of astute trading, which every farmer does not possess. This apart, farmers in surplus-producing states like Punjab and Haryana sell their produce at the minimum support price to the public agencies and as the minimum support price remains the same till the next harvest season, such farmers do not gain by storing the produce, unless open market prices in the lean season rise to such levels as to cover the cost of storage and still leave a margin as an incentive to store, which rarely happens. The worry on low utilization of warehouses by the farmers should be seen in this light. Even if the facility is utilized by the traders, it indirectly helps the farmers by way of augmenting the demand for commodities stored by the traders.
Suggestions
The projected availability of food grains and the currently available storage capacity in India show that there is big gap in storage capacity. This gap has to be bridged as early as possible if advantage is to be taken of the benefits of increased agricultural production. The Union Government, therefore, constituted a Working Group on Warehousing to go into this question. The Working Group, in its report submitted to the Ministry of Agriculture made the following recommendations:
(i) A network of rural storage centres should be built on a priority basis in order to prevent distress sales, wastage and loss arising out of inadequate and defective storage facilities;
(ii) These storage centres may be constructed and managed by panchayats, co-operatives and other suitable agencies selected by the State Government;
(iii) These centres may have a storage capacity of 100 to 250 tonnes, mainly for foodgrains and other agricultural produce;
(iv) The cost of the construction of these structures, may be met by a 50 per cent subsidy and 50 per cent bank loans. Out of the subsidy part, 35 per cent may be borne by the Central Government and 15 per cent by the State Government.
(v) Each rural storage centre should have a manager, preferably from the area served by the centre. The manager should be trained in the basic essentials of warehousing by attaching him to a warehouse of the CWC or SWC;
(vi) Technical guidance, supervision and assistance in the design, construction and management of the centres should be provided by the CWC/SWC free of charge, or at a nominal charge;
(vii) Farmers should be provided with receipts for the commodities stored by them. Each receipt should be a negotiable instrument to enable them to obtain credit from banks;
(viii) The banks should provide credit to the extent of 90 per cent of the value of the stocks stored by the farmers; and the credit should be provided at concessional rates of interest;
(ix) The scheme of rural storage centres should be linked with the procurement machinery for foodgrains and also with the public distribution system, and
(x) The programme should be co-ordinated by a state level co-ordination committee, of which representatives of State Governments, the department of agriculture, rural development, co-operation and panchayats, the SWC, FCI and nationalized banks, should be the serving members.
However, it must be recognized that the success of the warehousing scheme depends on winning the confidence of the depositors and making people at all levels aware of the intrinsic merits of warehousing. Steps taken by the Government of India to overcome the problems in marketing of agricultural commodities include the following among others.
Provide project import status with a concessional import duty of 5 per cent for the setting up of mechanised handling systems and pallet racking systems in ‘mandis’ or warehouses for food grains and sugar as well as full exemption from service tax for the installation and commissioning of such equipment.
Provide project import status at a concessional customs duty of 5 per cent with full exemption from service tax to the initial setting up and expansion of ♦Cold storage, cold room including farm pre-coolers for preservation or storage of agriculture and related sectors produce ; and Processing units for such produce.
Provide full exemption from customs duty to refrigeration units required for the manufacture of refrigerated vans or trucks.
Provide concessional customs duty of 5 per cent to specified agricultural machinery not manufactured in India;
Provide central excise exemption to specified equipment for preservation, storage and processing of agriculture and related sectors and exemption from service tax to the storage and warehousing of their produce; and
Cold Storages
The term cold storage refers to a refrigerated chamber for the storage of such perishable commodities as fruits, vegetables, fish, eggs, meat, dairy products, etc: In these storage structures, the temperature is controlled and maintained so that the stored perishable products may not deteriorate in quality. In a cold storage, the temperature is maintained in the range of -1.1oC to 10oC (30o to 50oF). The other form of cold storage is the freezer storage, in which the temperature is kept below 1.1oC (30oF), and the product remains in a frozen state.
In addition to the preservation of the quality of perishable products, the cold storage offers the following advantages:
(i) It makes possible the even placement of perishable commodities in the market. This would not have been possible without the cold storage facility.
(ii) It helps in the price stabilization of perishable commodities by removing the gluts occurring in the production season.
(iii) It helps in widening the market for the products, lowering marketing costs, raising the price realized by the producer and lowering the price to consumers, and ensures that products are available throughout the year.
(iv) Cold storage facilities have made it possible for consumer to live in greater comfort.
Till recently, the establishment of cold storage industry remained under regulation. The Central Government issued Cold storage Order in 1964 and later in 1980. However, some State Governments like that in West Bengal, Uttar Pradesh, Punjab and Haryana were permitted to promulgate their own orders. The Cold Storage Order was promulgated by the Government of India under Section 3 of the Essential Commodities Act, 1955. It was being administered by the Directorate of Marketing and Inspection to achieve the following objectives:
(i) To ensure hygienic and proper refrigeration conditions in the cold storage;
(ii) To regulate the growth of the cold storage industry in a planned manner;
(iii) To render technical guidance for scientific preservation of foodstuffs; and
(iv) To safeguard the interests of farmers and other depositors.
Cold Storage Order, 1964 and also of 1980 was applicable all over the country except in the States of Uttar Pradesh, West Bengal, Punjab and Haryana, where the State Governments have enacted their own Cold Storage Acts. West Bengal and Uttar Pradesh sought permission to enact their own Acts in 1960 and 1975. Punjab and Haryana Governments were permitted to promulgate their own State orders for regulating the cold storage industry in 1979.
Under the Cold Storage Order, the prospective entrepreneur was required to obtain the permission from the Agricultural Marketing Advisor to the Government of India for construction of a cold storage. With effect from 1st January, 1965, it was obligatory for a cold storage, with a capacity exceeding 8.50 cubic metres to obtain a licence before storing any foodstuff. The Agricultural Marketing Advisor to the Government of India was the authority under the Cold Storage Order, and it is he who is empowered to licence the setting up of a cold storage.
The Cold Storage Order, 1980 was rescinded in May, 1997. The repeal of the cold storage order of 1980 aimed at enabling the government in the removal of licensing, price control and requisitioning of the cold storage space with a view to allowing the functioning of free marketing mechanism for demand based growth of cold storage industry in the country free from all kinds of administrative interference.
Most of the cold storages are in the private sector. The National Commission on Agriculture in 1976 had recommended for adequate measures to be taken by co-operatives and public sector undertakings to provide cold storage facilities in production areas and terminal markets. As a follow-up, the National Cooperative Development Corporation prepared a project for setting up 4.8 lakh tones of cold storage capacity in the co-operative sector by 1985 with the World Bank assistance in the states of Uttar Pradesh, Bihar, West Bengal and Madhya Pradesh.
The first cold storage was established in India as early as in 1892 at Kolkata. But noticeable progress in expansion of the cold storage industry was not made until 1947. Even up to 1955, the total cold storage capacity in the country was only 0.771 lakhs tones. The number of cold storage units and their capacity in India are given in Table 7.7.
Table 7.7.
Growth of Cold Storage Facility in India
Year |
Number of Cold storage Units in Operation |
Storage Capacity |
1947 |
4 |
0.031 |
1952 |
100 |
0.592 |
1955 |
NA |
0.771 |
1960 |
359 |
3.055 |
1965 |
615 |
6.820 |
1970 |
1218 |
16.380 |
1975 |
1615 |
20.530 |
1980 |
2283 |
39.650 |
1985 |
2522 |
50.991 |
1990 |
2795 |
68.150 |
1995 |
3167 |
85.800 |
1996 |
3253 |
87.300 |
2001 |
4199 |
153.85 |
Source:(i) Economic Survey, Various Issues, Ministry of Finance, Government of India, New Delhi.
(ii) Directorate of Marketing and Inspection, Ministry of Agriculture and Rural Development, Government of India, Faridabad.
The rapid strides in the expansion of cold storage capacity were made after 1955. The cold storage capacity increased to 3.055 lakh tones in 1960, 16.38 lakh tones in 1970, 39.65 lakh tones in 1980, 68.15 lakh tones in 1990 and further to 153.85 lakh tones in 2001. The total number of cold storage units in the country in 1996 has been 3253, which increased to 4199 in 2001. There is a wide inter-state variation in the availability of cold storage facilities in India.
Sector wise Distribution of Cold Storage Facilities in India
Sector |
Number of Cold storage Units |
Capacity of Cold Storage Units (Lakh Tonnes) |
Private |
3739 (89.04) |
146.13 (94.98) |
Cooperative |
310 (7.39) |
6.80 (4.42) |
Public |
150 (3.57) |
0.91 (0.60) |
Total |
4199 (100) |
153.85 (100) |
Source: Report of Expert Committee on Strengthening and Developing of Agricultural Marketing, Ministry of Agriculture and Cooperation, Government of India, June, 2001.
Potato is the main product which is stored in the cold storage. Out of the total capacity utilization, 88 per cent is used for storing potato. Commodity-wise utilization of cold storage units in India can be seen in Table 7.9.
The construction of a cold storage requires heavy investment in terms of building and machines. Similarly, to run the cold store, the cost on electricity input is very high and it amounts to 50 per cent of total running or variable cost. As such there is need to develop low cost and energy saving cold storage units.
Commodity-wise Percentage Distribution in Cold Storage Units in India
Commodity |
Number of cold |
Capacity utilization |
Potato |
63.0 |
88.3 |
Fruits & Vegetables |
1.1 |
0.4 |
Milk & Milk Products |
6.9 |
0.7 |
Meat |
0.8 |
0.1 |
Fish |
11.3 |
0.9 |
Meat and Fish |
2.1 |
0.4 |
Multi-purpose |
9.7 |
8.0 |
Others |
5.1 |
1.2 |
Total |
100.0 |
100.0 |
For promotion of cold storage units in the private sector to meet their increasing needs, a capital investment subsidy scheme for construction/expansion/modernization of cold storages/storages for horticultural produce has been initiated by Government of India. This scheme is implemented by National Horticulture Board. Under this scheme, the promoters of cold storage units are provided 25% back-ended capital investment subsidy, 50% is provided as term loan and 25% is promoter's contribution. The proposals are considered and sanctioned by National Cooperative Development Corporation (NCDC) under cooperative sector. This scheme is implemented in those States/Union Territories, which do not control rentals for cold storages under any statutory or administrative order.
The available capacity of cold storage is much less than the country's requirements. It is barely sufficient for 15 per cent of potato production and for less than one per cent of fruits, vegetables and fish production. The cold storage requirement has further increased in view of the need to promote exports of processed foods.
There is a considerable scope for expansion of the cold storage industry in India. However, due to large capital requirements, lack of proper technical guidance, inadequate and fluctuating power supply and lack of appreciation for stored products, the entrepreneurs are not attracted to establish cold storage units. The lack of cold storage facilities is leading to heavy losses and violent fluctuations in prices of fruits and vegetables. There is a need to encourage cold storage industry in several regions of the producing areas as well as in large urban centres.
In India, the production patterns, dietary habits and economic considerations warrant long period of storage in large quantities of onion and potato. The conditions required for the storage of potato and onions are distinctly different. While the potato requires low temperature and high relative humidity, onions require low temperature and low relative humidity. Most of the cold storages in the country meet the storage requirements of these two vegetables. For other vegetables, temporary storage structures for short period usually not exceed a week are needed along the route of their movement from producing areas to consuming centres.
As per the estimates of the Expert Committee on Strengthening and Developing of Agricultural Marketing (Government of India, June 2001), there is a need for construction of 15000 cold storage units with 45 lakhs tones capacity in the next ten years for storage of increased output of horticultural products. There is also need for technological upgradation for cost effective refrigeration machinery and improvement in the methods of scientific preservation of perishable commodities.
The country would also need reefer containers/vans for transport of perishable commodities for domestic and export marketing. Their availability was nil in fifties but increased in recent years to 400. During the next 10 years, it is estimated that atleast 3000 reefer containers/vans each of 8 tonnes capacity would be needed to handle the available surplus of perishable agricultural products (Government of India, June 2001).
Considering the fact that an average farmer may not need and have access to mechanical refrigerated cold stores; ventilated storages like direct evaporation cooled structures; energy cool chambers; cool homes and forced evaporation cool stores have been developed. These structures provide relatively lower temperature and high humidity as compared to ambient conditions because of natural/forced evaporative cooling. These can be constructed with locally available materials. The zero energy cool home, AADF CIP design cool home and two-tier structures can be afforded by the farmers on their farms. However, other improved structures can be constructed by growers co-operatives or owners of large size farms.
The Associated Chamber of Commerce and Industry (Assocham), highest body of the Chambers of Commerce of India (CCI), providing a forum for dialogue between business and government said in its report “Food Processing and Agri Business” that the country is short by 10 million tonnes of cold storage capacity due to which about 30- 40% of agricultural produce goes waste every year. The report is jointly prepared by Assocham and international advisory company – KPMG.
According to Assocham’s latest study report, against a requirement of over 31 million tonnes of cold storage, India has a capacity of nearly 21.7 million tonnes, leading to a loss of about 40% of the agri-produce post harvest. About the new study on cold storages S Jindal, president – Assocham, said, “Cold storage facilities now available are mostly for single commodity like potato, orange, apple, grapes, pomegranate and flowers, resulting in poor capacity utilisation. Long and fragmented supply chain in India along with inefficiencies lead to huge losses due to wastage or shrinkage of perishable commodities.” The industry body has also asked the government to build new cold chain infrastructure to increase its storage capacity.
At present, the Indian cold chain market is worth $2.6 billion. This market is expected to grow to $12.4 billion by 2015. Uttar Pradesh and West Bengal have 65% of the total installed capacity of cold storage in the country. Cold chains are used primarily for fruits and vegetables, meat and marine products, floriculture, dairy products, ice creams and confectionery. Further, the report said that entire supply chain in the country is dominated by unorganised players with several intermediaries adding to wastage from farm to consumer via retailer, processor or exporter. In a long supply chain, one level is unaware of requirements of next level, leading to disconnection between farmer and processor. Secondly, absence of any structured market hampers discovery of correct price and availability of consistent quality of produce.
India is losing food items worth a whopping Rs 50,000 crore (Rs 500 billion) every year due to poor post-harvest handling of farm produce, a development that analysts say may jeopardise the Centre’s plan to formulate a food security law, especially in view of a “below-normal” monsoon. “The level of wastage of agricultural food items is estimated to be about Rs 50,000 crore (a year), occurring at various stages of handling after harvesting,” food processing minister Subodh Kant Sahai said in a written reply in the Rajya Sabha.
Identifying the need for food safety and quality, the Ministry of Food Processing Industry, Government of India, has earmarked Rs 250 crore towards the sector under the 11th Five-Year Plan. Deliberating in the oneday seminar on ‘Sensitizing Programme on Food Safety Systems,’ organised by the Confederation of Indian Industries (CII), K Rajeshwara Rao, Joint Secretary, Ministry of Food Processing Industries said, “it is vital to sensitize masses about important aspects of protecting themselves against foodborne diseases.’’ Sharing details about a scheme implemented by the Central Government in assoication with CII, NGOs and municipal bodies to improve food safety in the streets, Rao said, “this scheme lays down standards, quality upgradation and capacity building of street food vendors in about 50 cities across the country through microfinance linkages.’’
“Safe farm produce could be unfit for human consumption during transportation, storage, packaging, food preparation in kitchens, if handled unhygienically,’’ said Utpal Sen Gupta, chairman, CII AP chapter and vice chairman, Agrotech Foods Limited.
Model Quiz
- Food Corporation of India was established in the year
a. 1955 b. 1965 c. 1972 d. 1975
Ans: b - Buffer stock operations does not ensure
a. Price fall b. Price stabilisation c. Food securityd. None of these
Ans: d - Building buffer stock is possible by
a. Domestic procurement b.import c. Both a and b d. None of these
Ans: c
TRUE or FALSE
- Warehouse can be used to secure upto 90 per cent of the value of commodity stored. (False)
- Warehouses help in stabilizing the commodity price by staggering its supply throughout the year (True)
- Warehouses do not provide market intelligence to persons who hold their produce there. (False)
- A farmer cannot store the commodity in a public warehouse. (False)
- Bonded warehouses are meant for use by exporters and importers only. (True)
- State warehousing corporation cannot get loan from the National Cooperative Development and Warehousing Board (False)
- Only notified commodities could be stored in the central warehousing corporation godowns. (True)
- Central government is providing up to 50 per cent of the capital cost for constructing rural godowns as back ended subsidy (False)
| Download this lecture as PDF here |
![]()